
Reporting
One API for all the company's systems — and one overview that is right now.
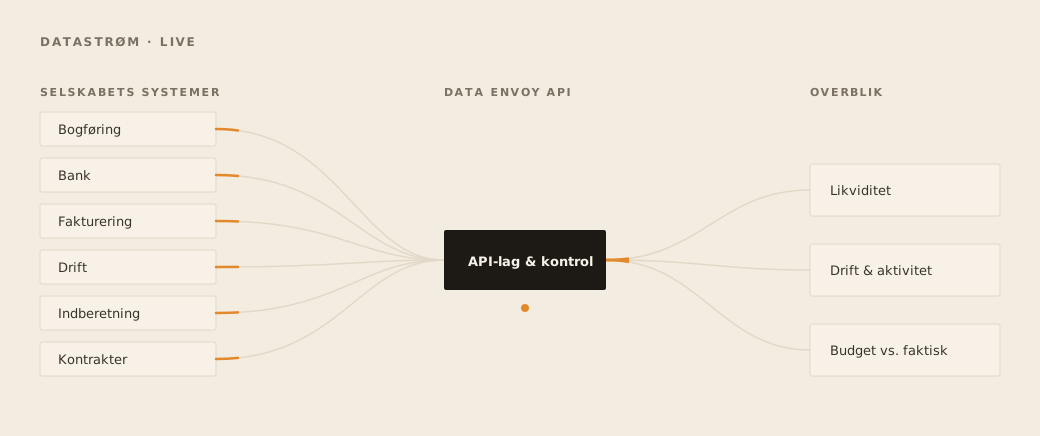
We pull data across bookkeeping, bank, invoicing, operations and the public authorities, and deliver it as one live, updated picture. Not a set of accounts that tells you what happened six weeks ago.
Data across systems — pulled directly, not typed in
We build API connections to the software the company already uses. There is no manual data entry, no weekly Excel exercise and no version that is three days old. Data is fetched at the source and updated continuously.
That gives one shared set of numbers: management, the owners and the board see the same thing, at the same time — and they see it while there is still time to act on it.
- Bookkeeping and trial balance
- Bank and payments
- Invoicing and subscriptions
- Operations, installations and activity
- Public filings
- Contracts and commitments
From source to decision — without a middleman typing
- Cash today
- 4,820
- Transactions in draft
- 12
- Month against budget
- 103.4%
Updated continuously
Checking the simple things that are expensive to miss
Does the bank match?
The bank balance in the books checked against the actual balance pulled from the bank. If they differ, you know today — not at the next reconciliation.
Are the books up to date?
How many transactions are sitting in draft, how old are they, and what is missing before the numbers can be used for anything?
Has it been filed?
VAT, tax account and other deadlines — status and next due date, without anyone having to remember.
Contracts
Term, notice period and status. Which expire, which renew automatically, and what do they cost?
Today's sales
Revenue, orders and invoicing today, this week, this month — against the same period last year.
Activity and operations
Installations, jobs and deliveries as drivers of both revenue and cash flow.
Three key figures — with the full story behind them
A dashboard showing forty numbers shows, in practice, nothing. We break the business down into three key figures that management can remember and steer by — and put the breakdown one click below for those who need to dig.
Each figure is held against the month's budget: where you are now, where you are expected to end up, and what the variance is. The comparison with the last three months and the same period last year is part of the picture — not a separate report.
- Key figures
- 3
- Updates
- Live
- History and last year
- 12 mo.
Reporting at the interval you ask for — with a proposed meeting agenda
Daily, weekly or monthly: one combined report where the variances are found, explained and prioritised. It ends with a concrete proposed meeting agenda — the points the numbers say you should decide on at the next meeting.
Reporting should not tell you what happened. It should tell you what to decide.
Want to see your own numbers live?
We connect to a single system to start with and show you the difference before you decide anything.
Talk to Roger